
Visibility rides the enforcement path
Every interaction on the governed path crosses the same four functions on its way to a model. OBSERVE writes the record as it happens, and TRACE seals it.
| THE LIVE PICTURE | Every interaction observed inline on the governed path, across applications, gateways, APIs, agents, tools, and endpoints |
| CONTEXT PER EVENT | Identity, data classification, destination, intent, and the decision that was enforced travel together |
| YOUR SIEM, FED | Every decision exports as a sealed, metadata-only receipt to the pipelines your SOC already runs |
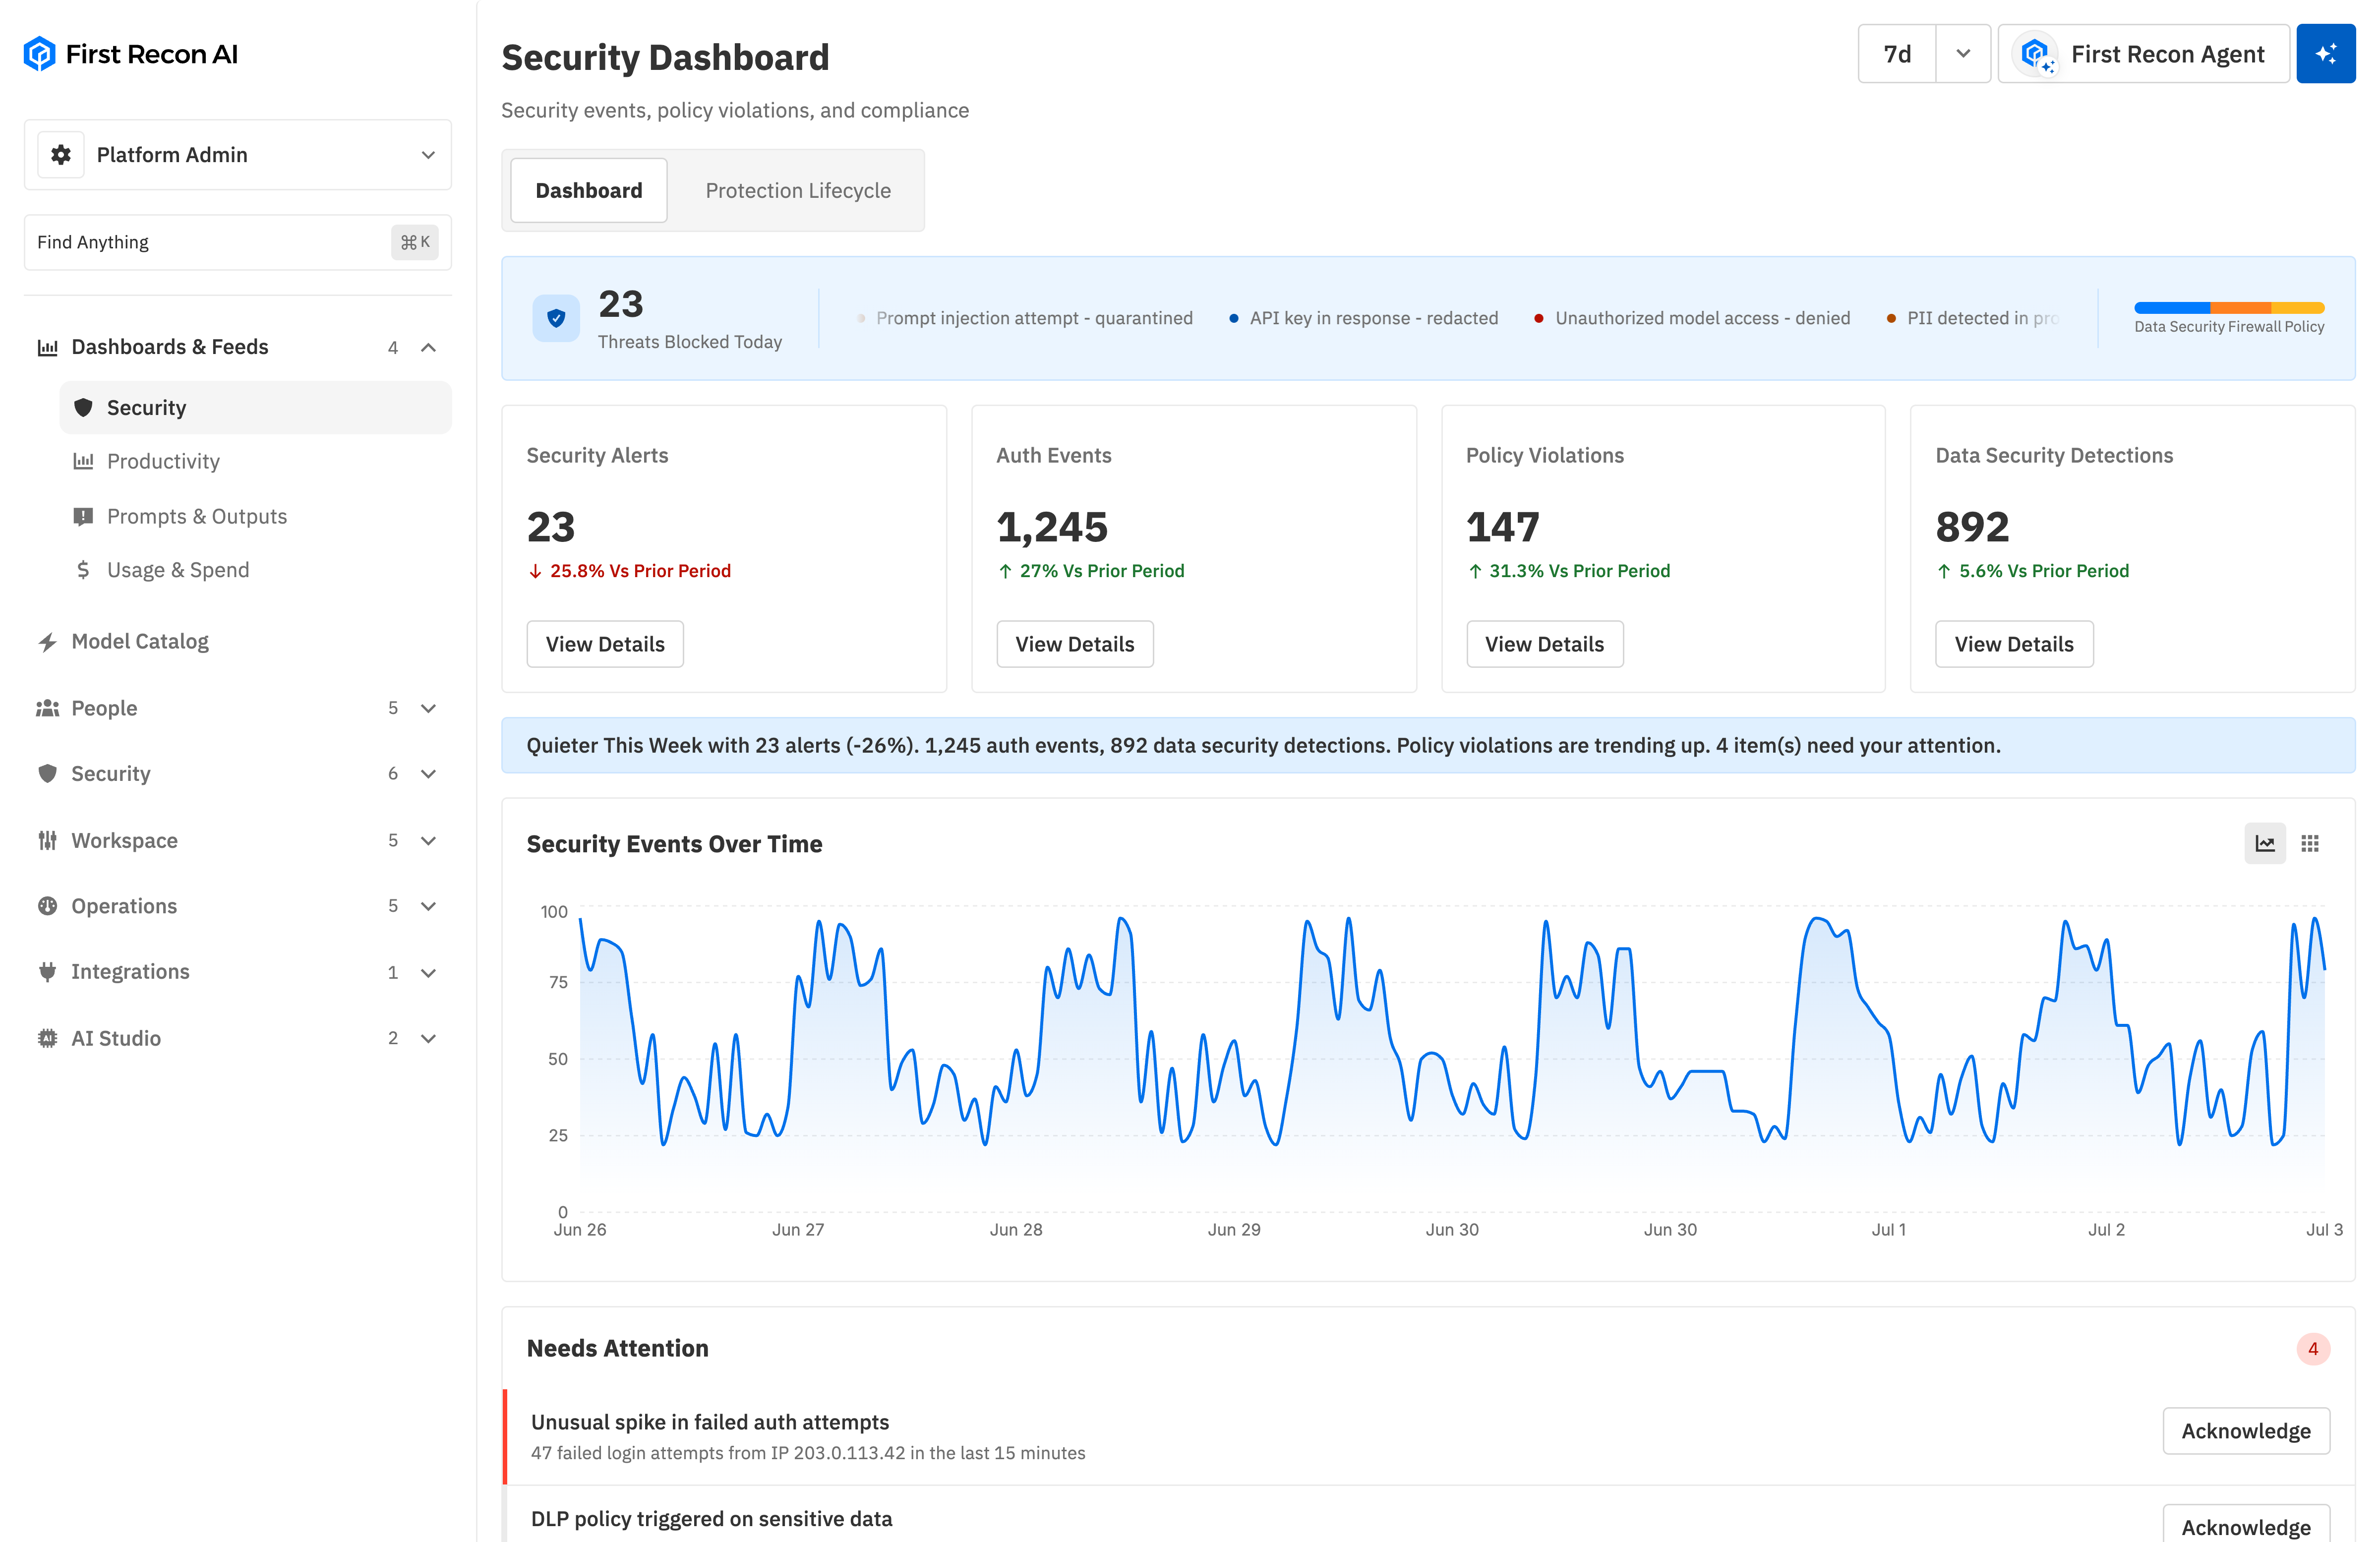
| CURRENT DASHBOARDS | Security, spend, and adoption views fed by the same decisions that enforce policy. One source, nothing to reconcile |
One console shows the whole AI picture
Observability makes accountability easier. The live security posture your team works from is built from the same decisions that enforce policy, on the same console that secures and governs every surface.
Integrations and exports
How is this different from the logs our AI providers already give us?
Provider logs are one vendor's slice, written after the fact, with no policy context. The runtime observes on the path, across providers and surfaces, and every event carries the context that matters in an investigation. Who acted, what class of data, which model, and what was enforced. For AI tools you have not sanctioned or discovered yet, start with Shadow AI Discovery.
How does it work with our SIEM?
Dashboards give your team the live picture, and every decision also streams to Splunk, Datadog, and Elastic as sealed, metadata-only receipts, so alerting, correlation, and investigations stay in the workflow your SOC already runs.
What is in the exported events?
Each exported event contains the surface, actor, detection class, policy and version, action taken, and an integrity hash. It does not duplicate prompt or response bodies. Conversation content may remain in the user's account as conversation history.
